Defining the Project: For this project, I was asked to create a mobile app platform that allowed people to self-track their data in a meaningful but efficient way. This data dashboard allows individuals to track their daily routines and habits to better understand their bodies and to help them achieve their goals. I chose to recreate the 75 Hard app. Right now the original 75 Hard app is just a checklist. I wanted to create a new and approved data dashboard for this challenge. I chose this app because I do believe it is a difficult challenge to complete over 75 days but designing an app that makes people excited to complete their goals and conquer different challenges will make this challenge a little less hard.
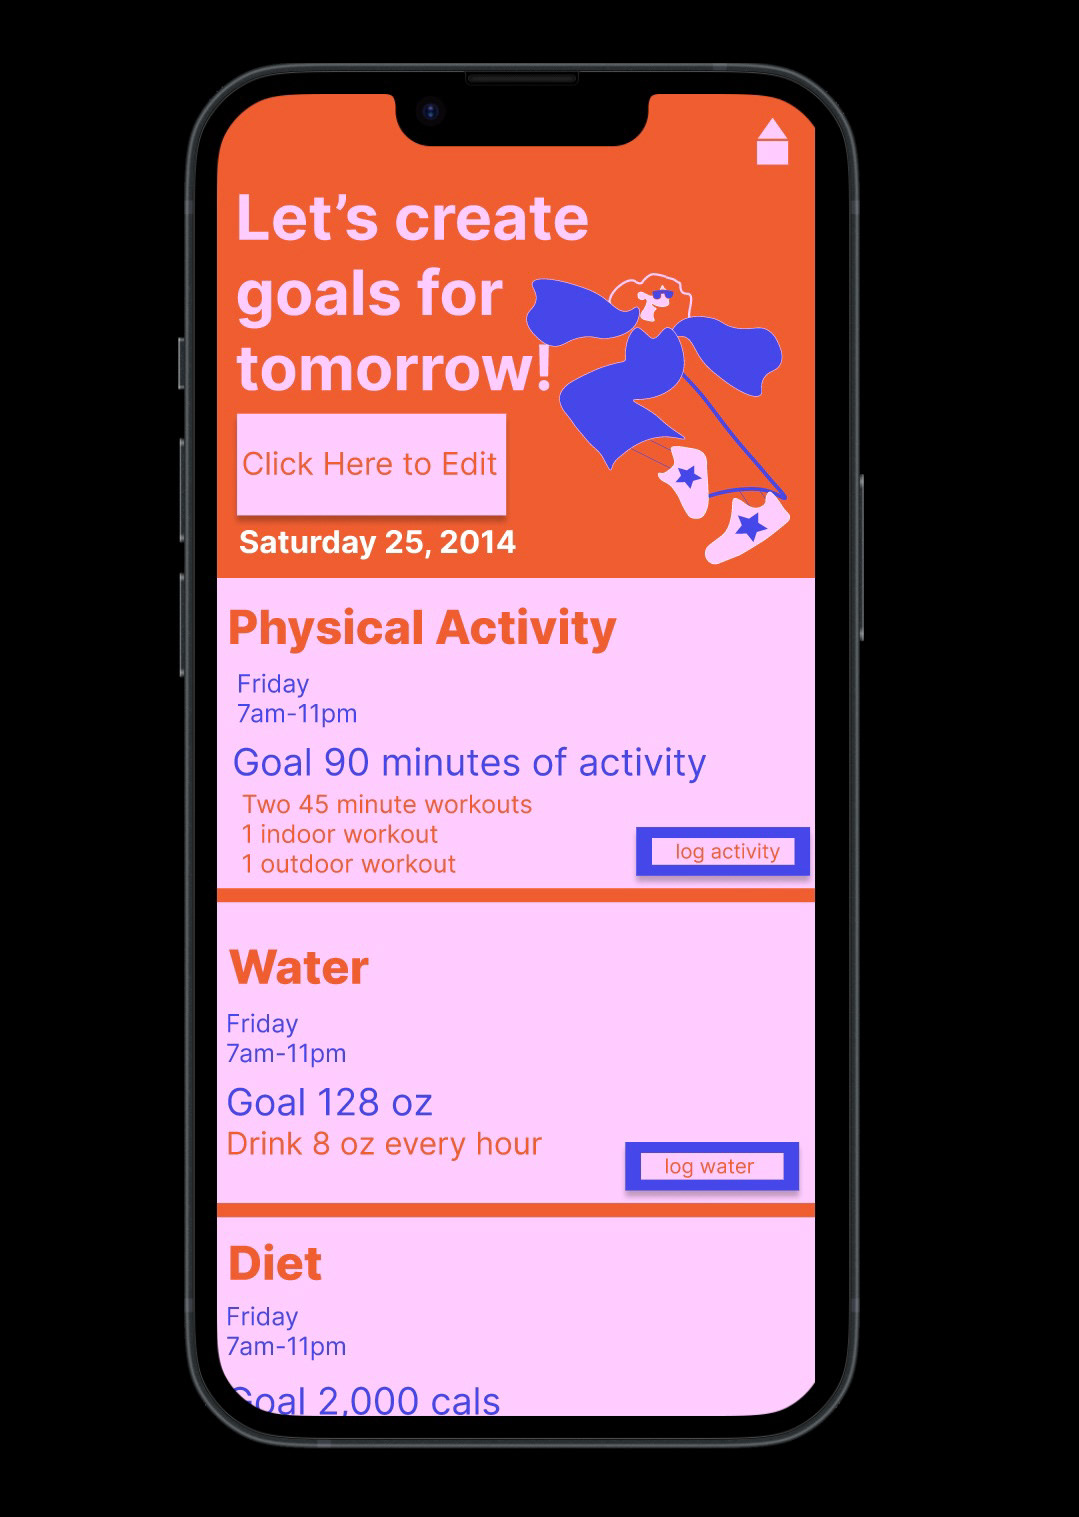
Objective: For this project, my goal was to create a better version of the app 75 Hard. 75 Hard is a challenge that requires mental and physical toughness. For 75 days you have to do two 45-minute workouts a day and one has to be indoor and the other has to be outdoor. You have to drink a gallon of water a day and follow a diet of your choice that does not include alcohol. You also have to read 10 pages of a non-fiction book every day. This is a very hard challenge to take on so I wanted to rebuild the app to make the experience and the challenge a little easier.
Target Users:
-self-motivated individuals
-active individuals
-individuals who enjoy a challenge
-self-disciplined individuals
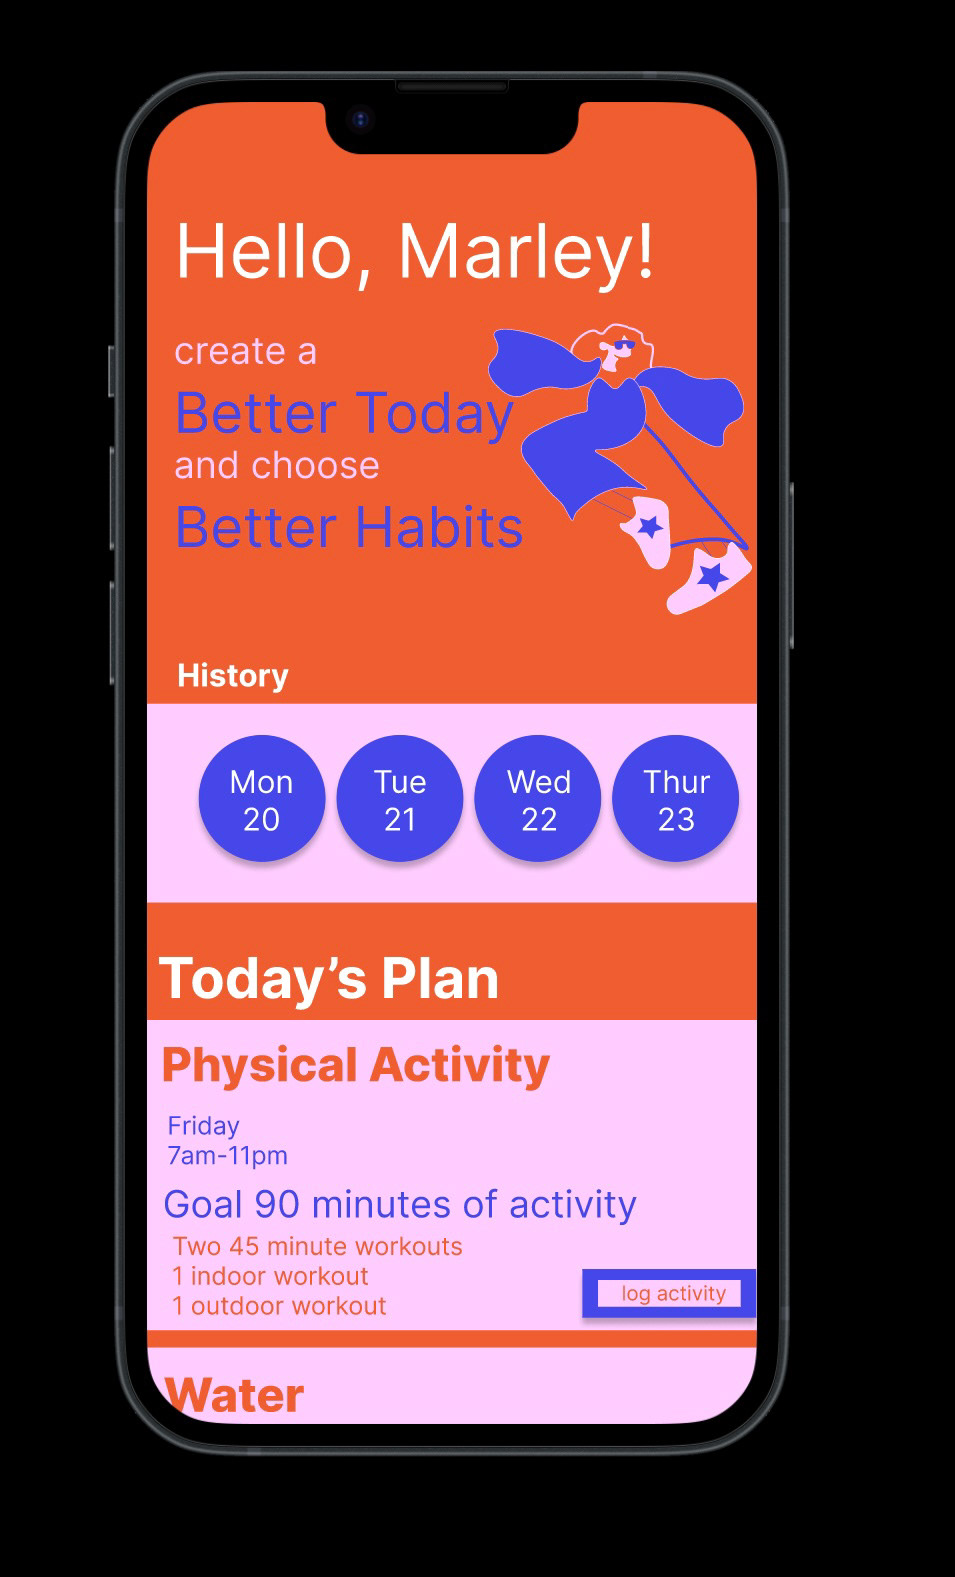
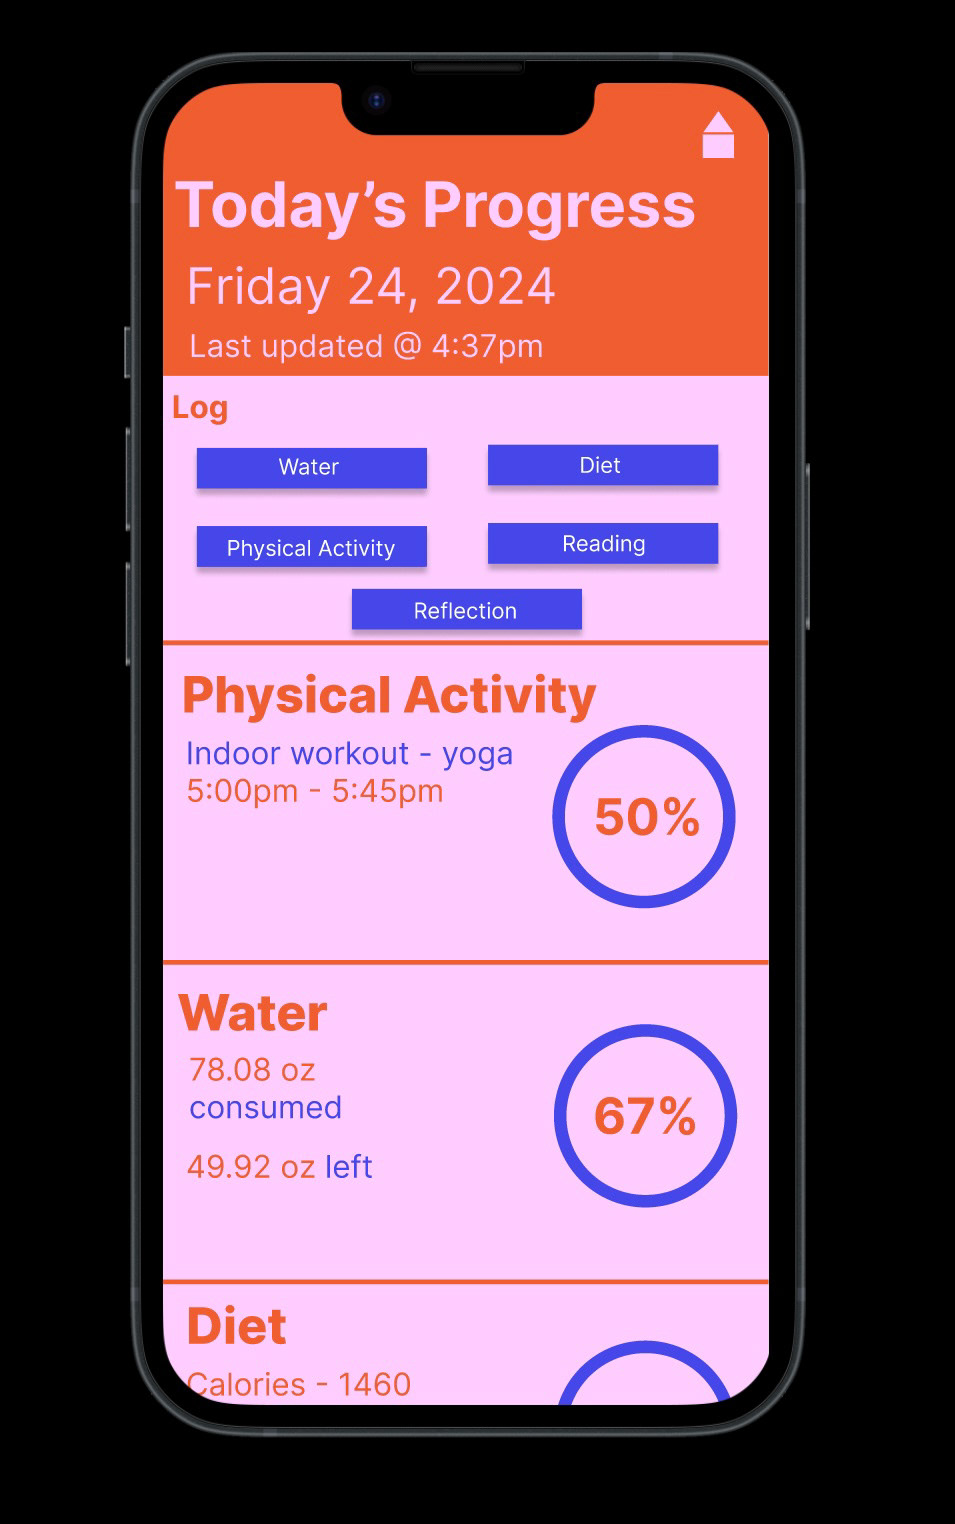
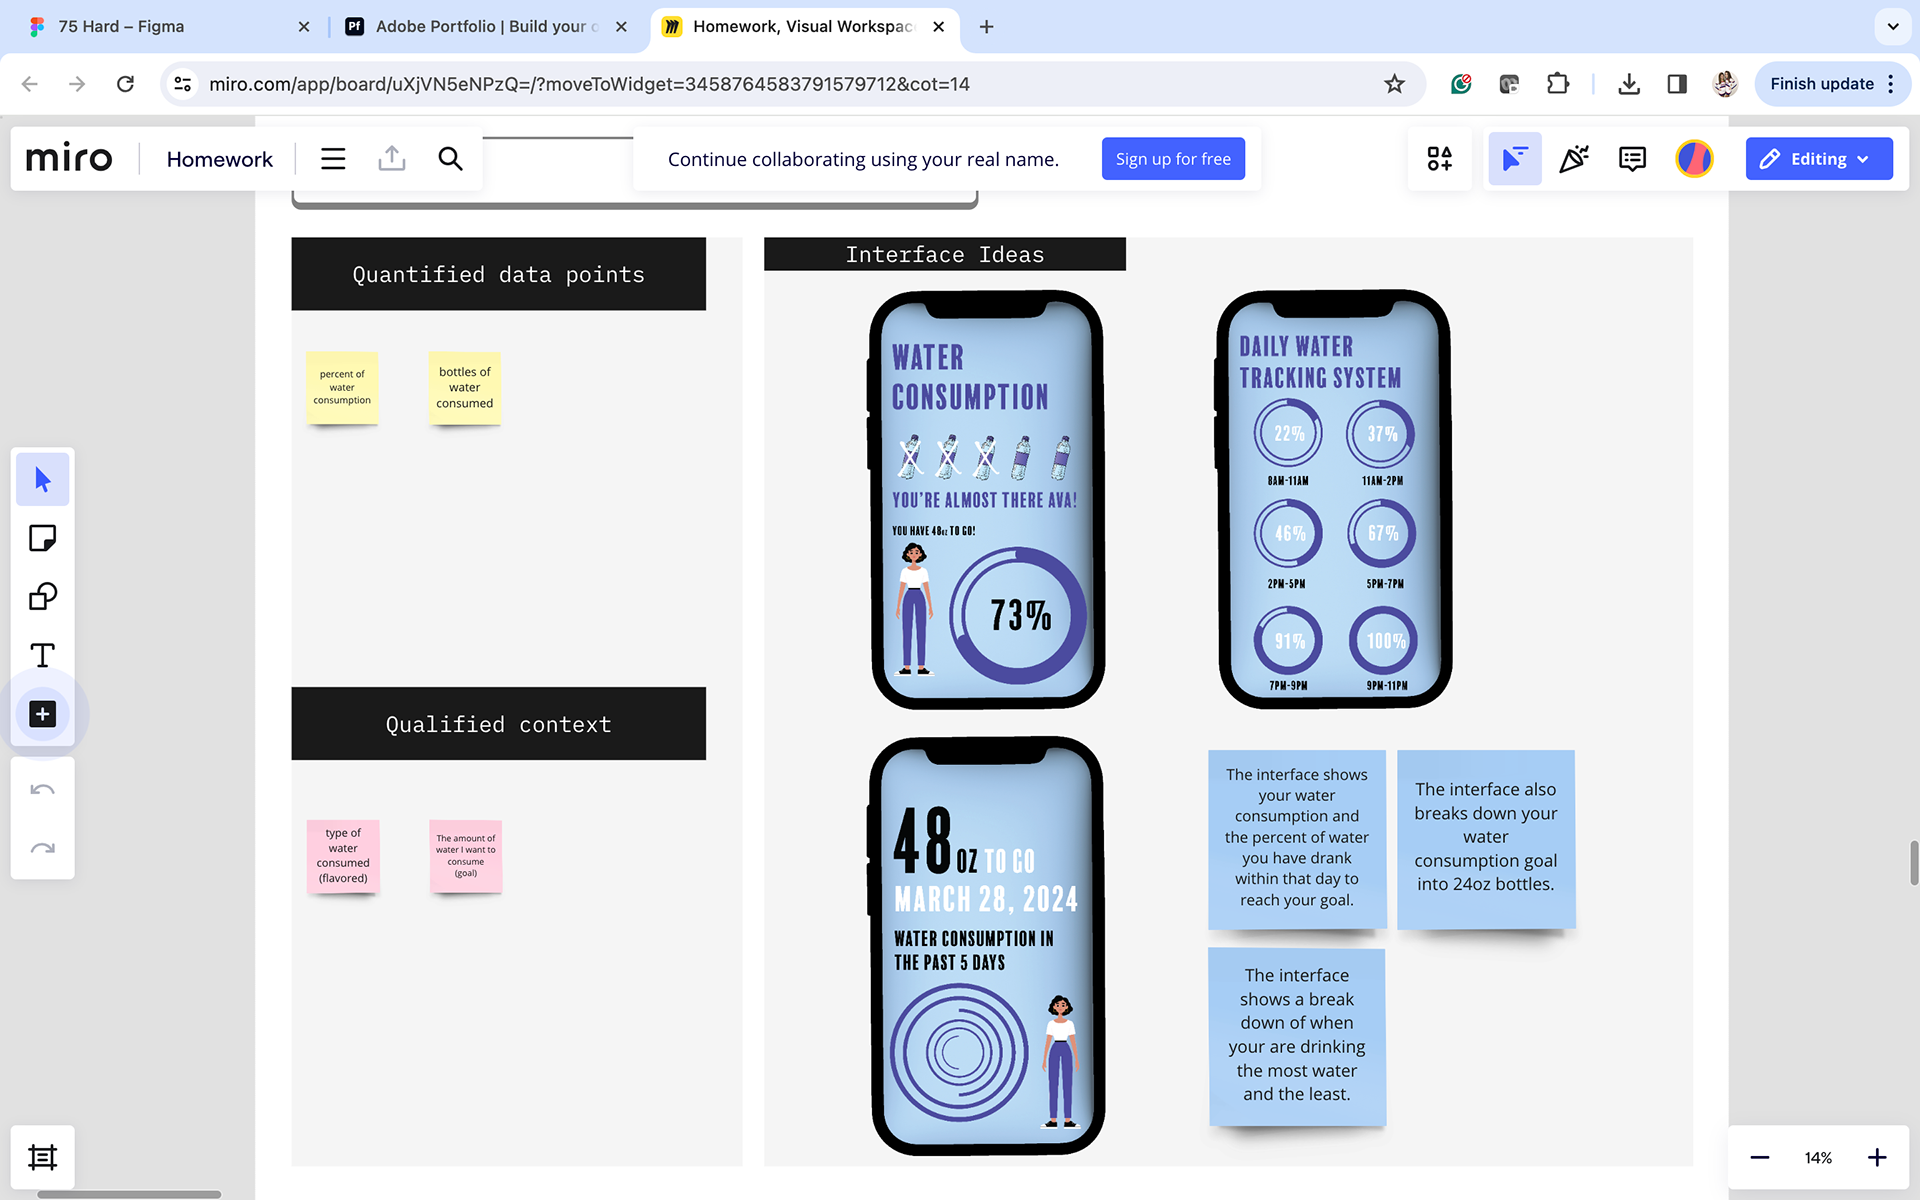
Data Points: It is a self-tracked app so as soon as you complete a task or are working to achieve that goal you can log your progress throughout the day.
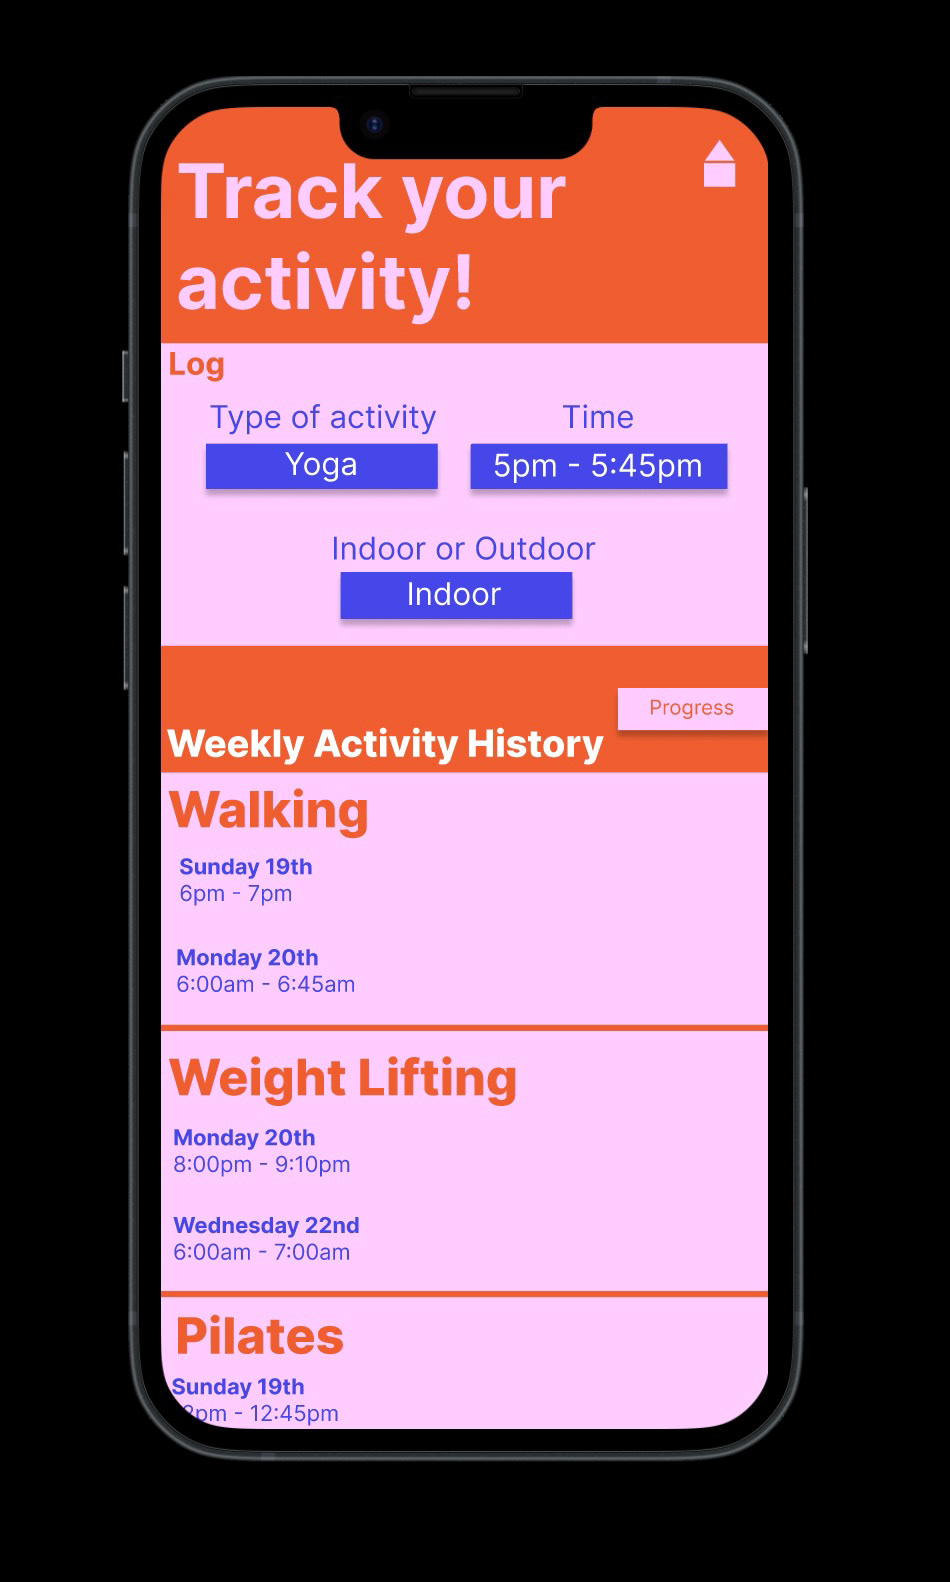
Physical Activity = Measured by type of activity and minutes
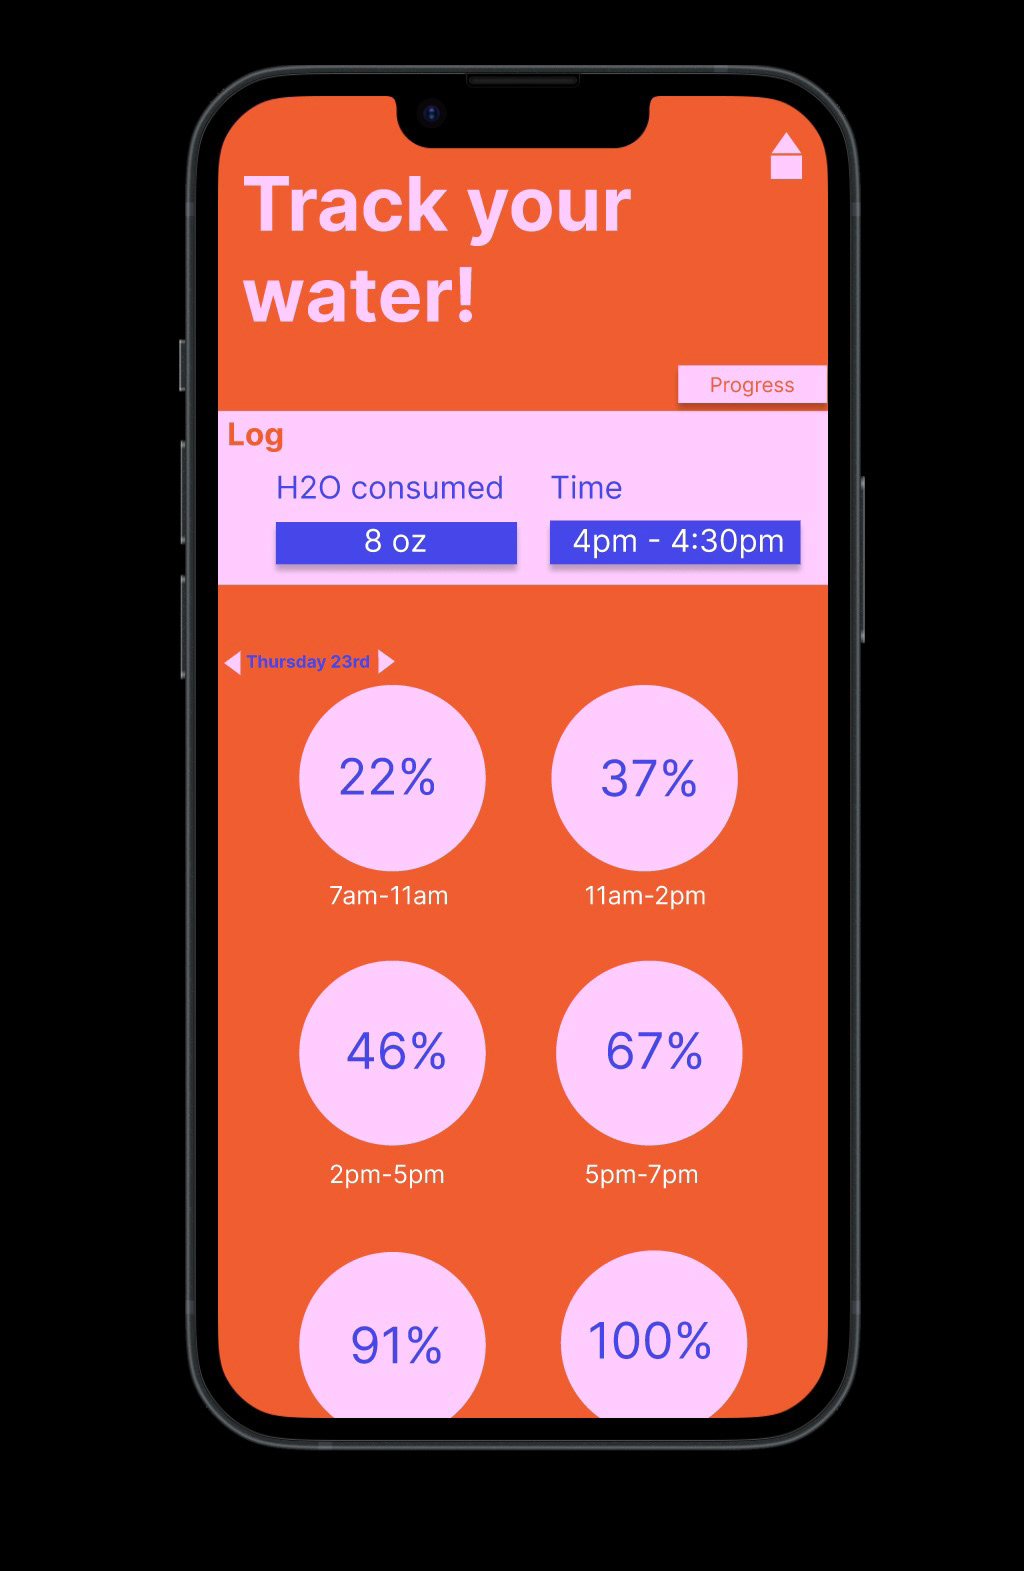
Water = Measured by oz...goal is to reach a gallon of water a day
Diet = You follow a diet of your choice but you can log your calories, carbs, sugars, and proteins as you finish each meal or snack throughout the day
Reading: You can record the number of pages you read throughout the day and what type of non-fiction book you chose to read
Initial Observations:
-My overall objective was to create a data dashboard for the 75 hard challenges that made the challenge just a little bit easier. Like I said previously it is a hard challenge within itself and the last thing you need is to have to deal with is a tricky and confusing app to make sure you are staying on track with your goals and requirements. I did the challenge for a week to understand what I would want in an app to help me complete this challenge. It is very hard in itself to keep track of your macros so I found that I needed a specific tab where I could log my calories, carbs, sugars, and proteins. I also found that I need a tab to help keep track of my water and to help keep me motivated throughout the day. If you can't see your progress throughout the day you feel like you are at a standstill. The live percentages of your progress on the app help give you motivation to finish your goals and requirements.
Tools & Techniques: Some tools and techniques that I used to help me navigate through this project are the original 75 hard app, dribble, and Pinterest. These apps helped me research and experiment to figure out what data dashboard is most effective.
Findings:
-While creating a data dashboard you have to be considerate of your target audience. You have to think about what would be easiest and most convenient for them. You also have to think about what you could do to make your data dashboard stand out from other similar platforms.
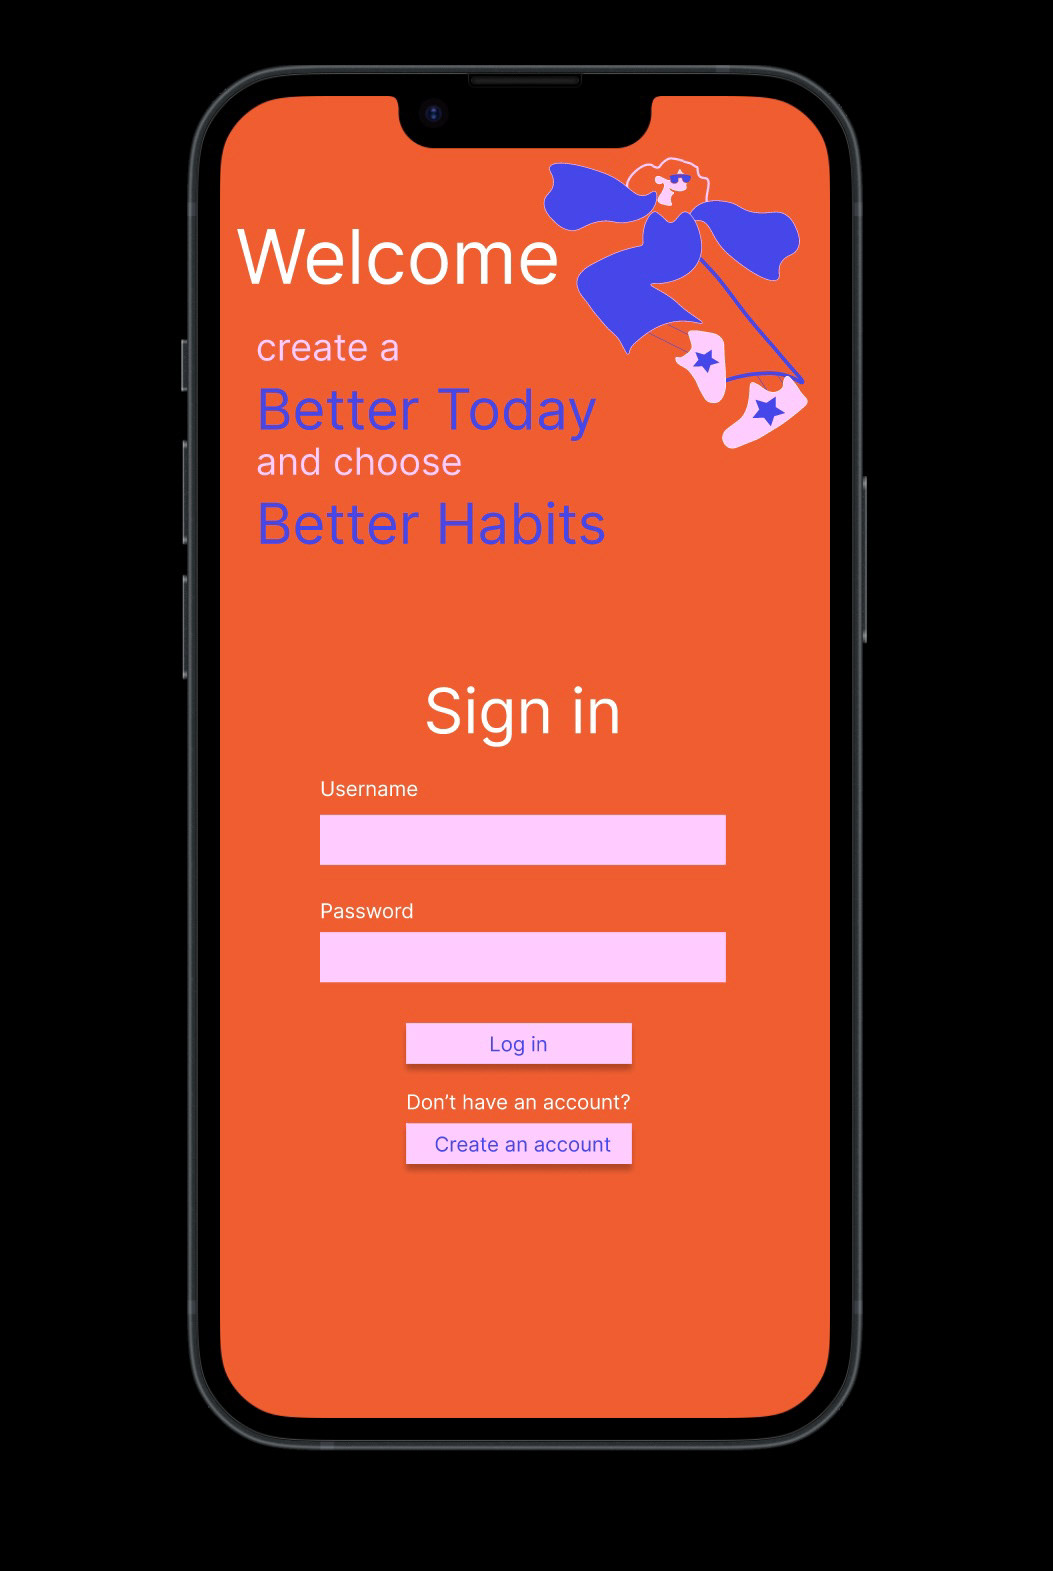
Concept Development: After using the original 75 hard app for a week I began to understand what an individual needs to help them complete these difficult challenges. You need an app that helps you keep track of your data without much thought put into it. You need a friendly and inviting platform that makes you motivated and excited and allows you to want to keep going with your challenge. The original 75 Hard app is just a checklist and it feels very masculine which can be intimidating to most people. I wanted to change that and create a platform that feels welcoming and is for everyone because everyone can do hard things!
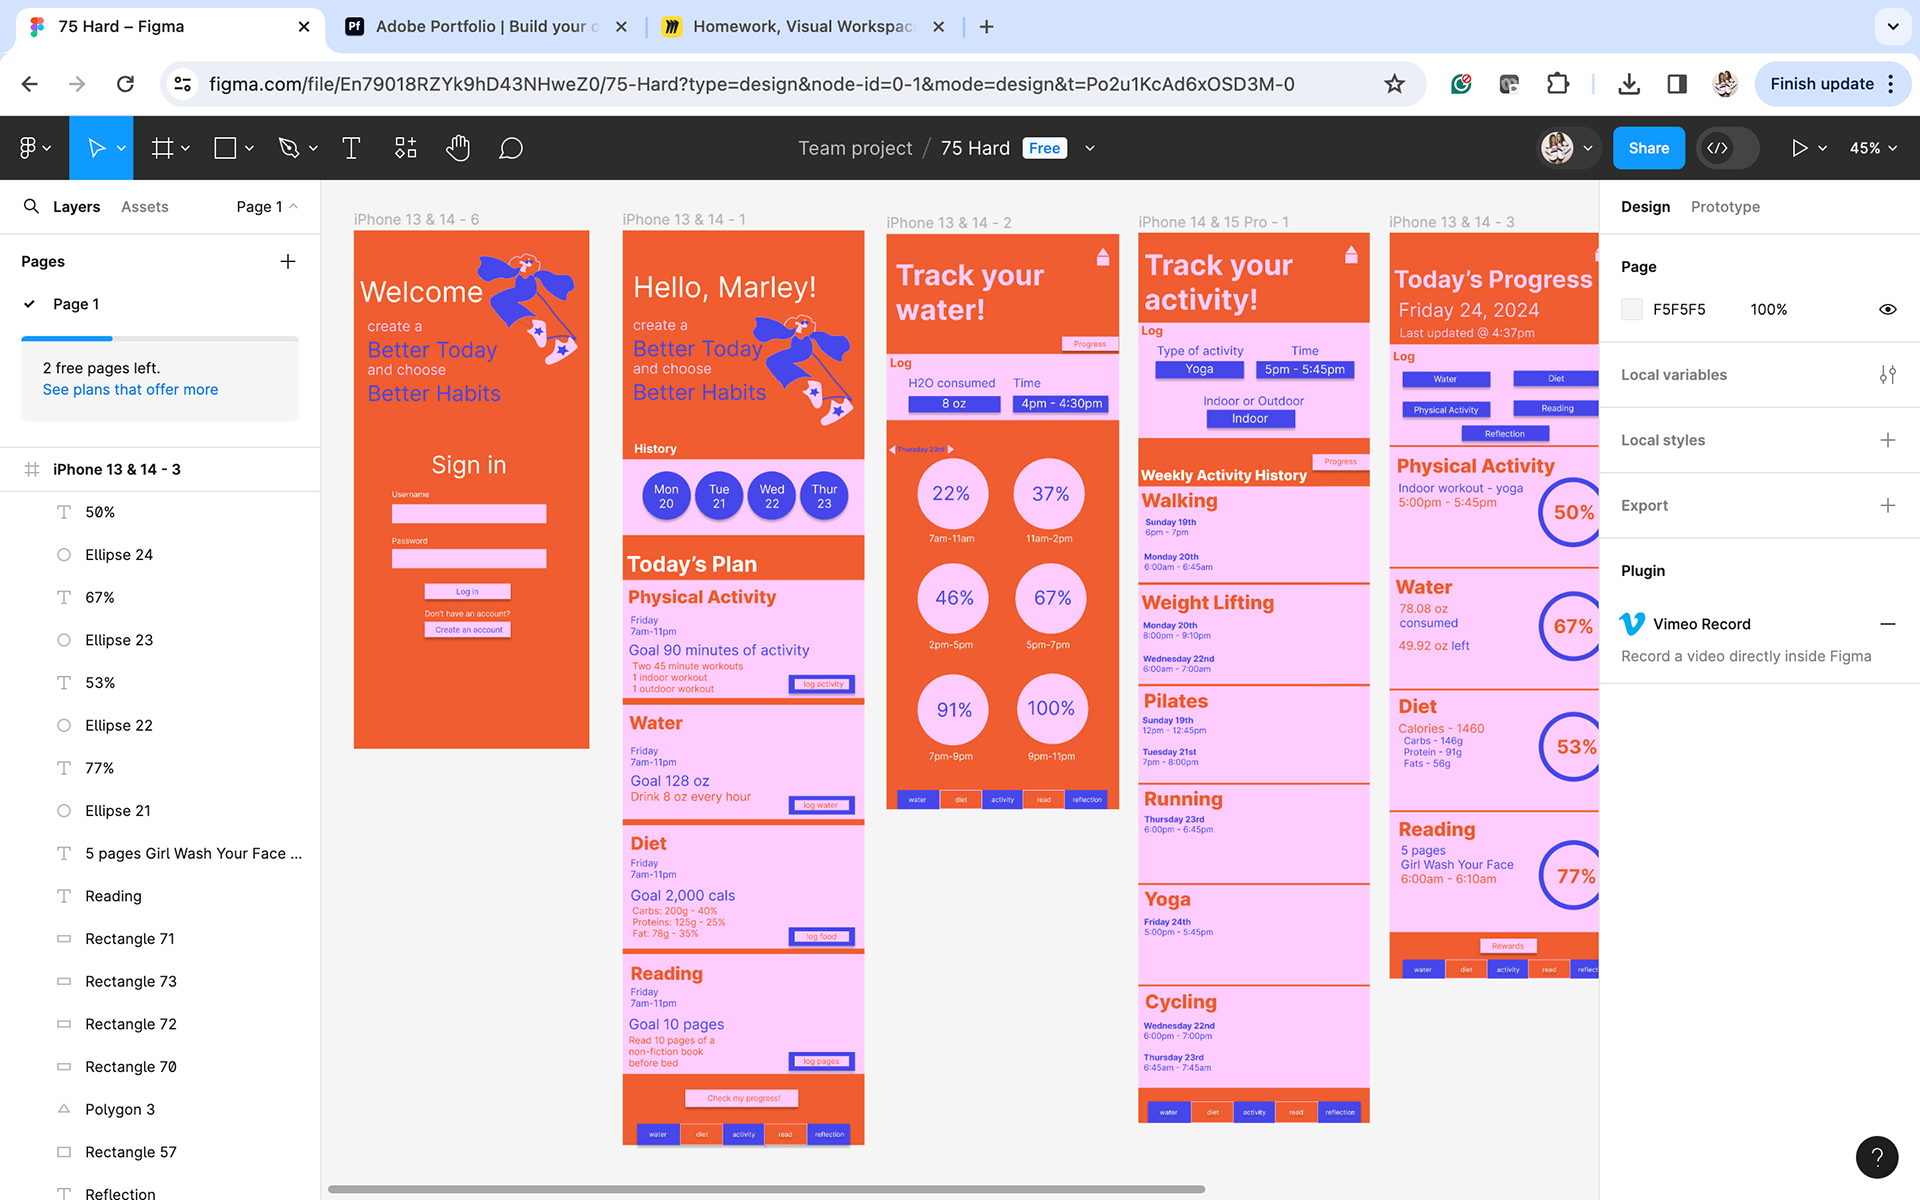
Sketches & Drafts
Iteration: While I was experimenting with the data dashboard I did a lot of prototypes and I had my classmates/friends test them to understand if they were easy to navigate through. Like I said previously, I did not want to make the app harder to navigate through than the challenge itself. This app is supposed to act as an assistant to the person who is completing this challenge.
Reflection
Challenges: During this project, I struggled to make everything feel cohesive. With a couple of iterations and different prototypes, I figured out a smooth dashboard that allowed individuals to thoughtlessly navigate through the dashboard.
Learnings:
Future Directions: In the future, if I were to do this project again I would do more research. We had little time to complete this project and I had to cut my research portion short. I want to understand what other people completing this challenge need and want in an app. I only experimented with myself and talked to two other individuals currently doing the challenge. There is always room for improvement.
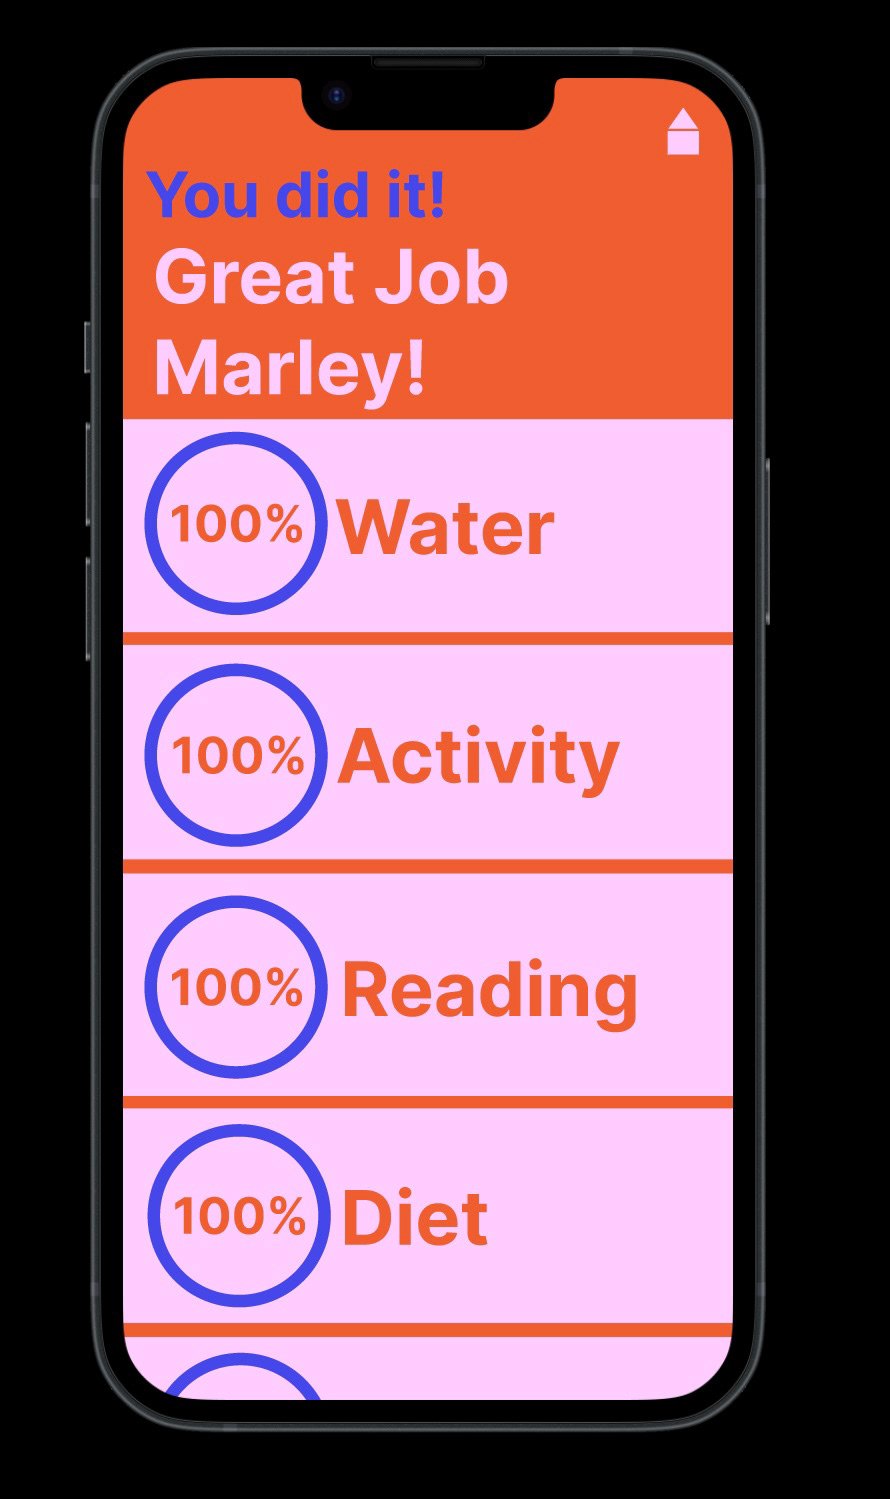
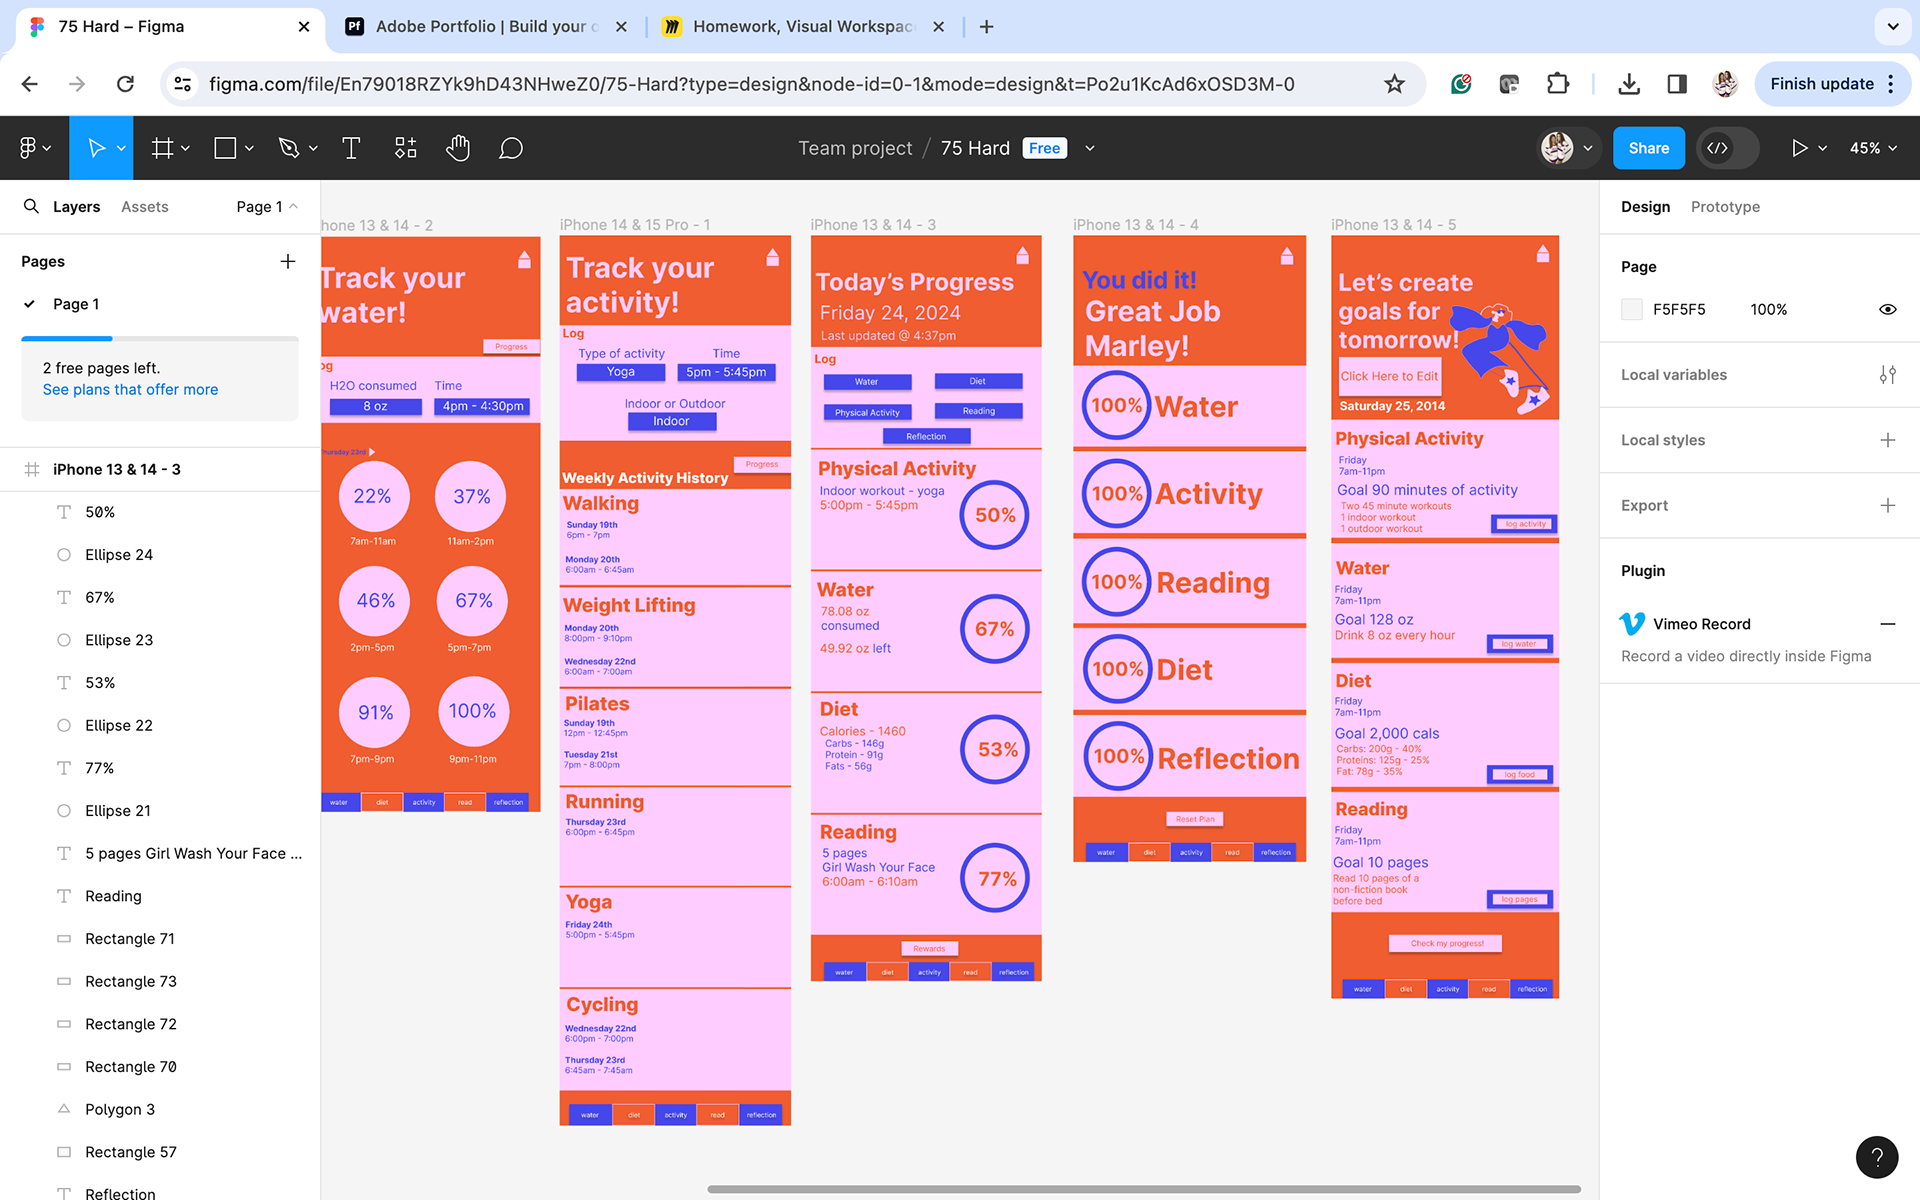
Final + iterations: